


Which gets us to a total ... Households are currently spending around $241 billion each quarter.

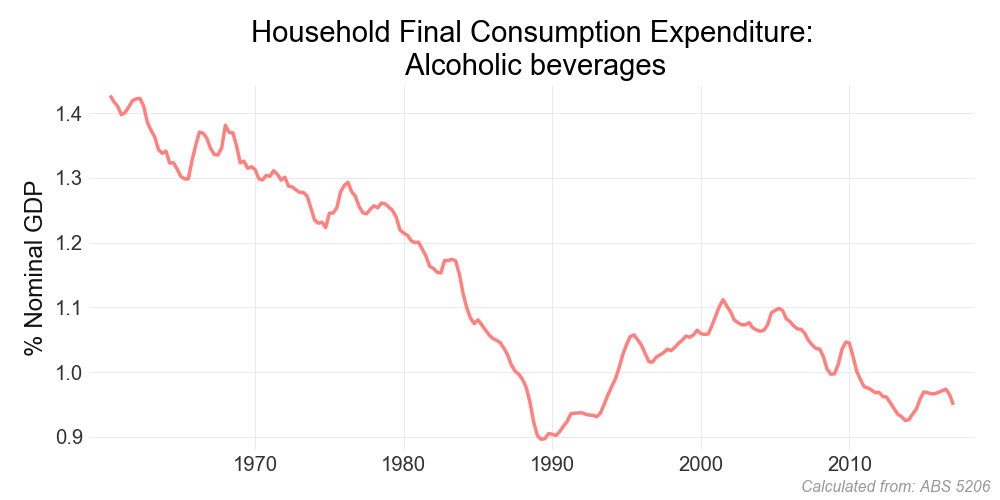
As interesting as these numbers are, they are largely growing because of population growth. If we divide household expenditure by GDP, we can get a sense of the growth or decline in these expenditure categories. In the next set of charts we divide current price expenditure by nominal GDP (using a rolling four term sum for both expenditure and GDP). There are some interesting stories here: The fall in spending on cigarettes and tobacco can be attributed to public health and taxation measures. The fall in clothing and footwear expenditure can be attributed to the removal of tariff protections. Electricity gas and other fuel costs have risen sharply since 2009; while food costs have almost halved since 1960. Newspapers, books and stationary have been declining since 1990, some of which may be attributable to technological disruption.


All in all, Household Final Consumption Expenditure has hovered between 50 and 60 per cent of the size of the economy since 1960.

gre
ReplyDelete