The shape and slope of the new curve tell us about the growth rate in the cumulative series.
- A horizontal straight line in new cases tells us that the cumulative number is growing at a linear rate along the lines $y=mx+b$, (where m is positive).
- An upwards sloping straight line in new that rises to the right tells us that the cumulative cases are rising with a power equation along the lines $y=x^m+b$, (where m is greater than 1).
- If the new cases are curving upwards to the right at an increasing rate, this tells us the growth rate in the cumulative series is exponential. The form, in this case, will be something like $y=m^x+b$, (where m is greater than 1).
- What we would really want to see is a new line that slopes downwards to the right. This tells us that we are arresting growth in the cumulative.
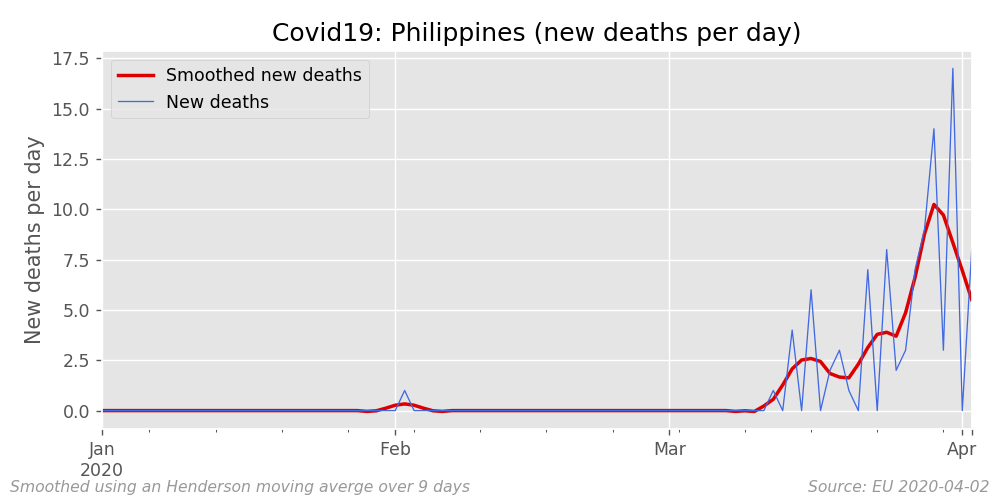
We smooth the differenced cumulative data to get past the noise in the data. This makes it much easier to see the underlying trend in the new data (and infer what might be happening in the cumulative data).
And we can difference this smoothed data again (following our analogy, this is like the second derivative of cumulative data; that is to say, $\frac{d^2y}{dx^2}$). Having this twice differenced data allows us to be more precise about what is happening in the trend with cumulative cases. [Note, I have not included these charts below].
Caveats:
- The Henderson smoothing process can introduce artefacts to the data, especially at each end of the data as the smoothing window becomes smaller. But this is a reasonable compromise, as much of the new daily data is so noisy.
- A larger Henderson smoothing window will make the trends easier to see, but the series will be less responsive to changes in that trend. Turning points and inflexions take longer to show up in the smoothed data, the larger the window for the Henderson moving average.
A complete set of charts for 2 April follows - first new cases, then new deaths.


way to go Mark
ReplyDelete